>> Crash Facts
 Why Pedestrians and Bicyclists Matter
Each year more than 3,000 pedestrians and 850 bicyclists are hit by vehicles in North Carolina, making North Carolina one of the least safe states in the US for walking and bicycling. On average, about 160 pedestrians and 20 bicyclists are killed each year in the State, representing about 15% of all traffic fatalities that occur on North Carolina roads. In collisions with cars, pedestrians in particular have a lot to lose. Those hit at 40 mph have an 85 percent chance of dying.
We are all responsible for making sure our roads are safe for everyone, including pedestrians and bicyclists.
Frequently Asked Questions
The following statistics are based on a study of police-reported pedestrian and bicycle crashes that occurred over a five-year period in the Triangle area of North Carolina. Past studies have estimated that police-reported crashes represent only about 56 percent of pedestrian and bicyclist incidents that occur. Click here for more on pedestrian and bicycle crash statistics statewide.
- Where are pedestrians and bicyclists being hit?
- One in four vehicle-pedestrian crashes in the Triangle happen when the car is turning at an intersection or driveway.
- Nearly one in three vehicle-pedestrian crashes in the Triangle happen in parking lots.
- More than half of all vehicle-pedestrian crashes in the Triangle occur near bus stops or on roads with bus routes.
- About 56 percent of all vehicle-bicyclist crashes in the Triangle occur at intersections, with about a quarter of all crashes occurring when a vehicle is turning.
- Who is most often involved in these crashes?
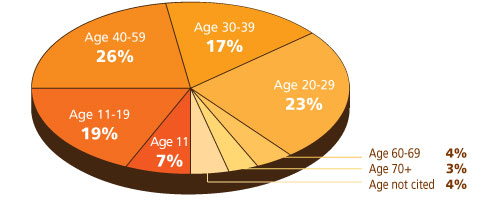
- Pedestrians by age group
 under 11 – 7 percent
- 11-19 – 19 percent
- 20-29 – 23 percent
- 30-39 – 17 percent
- 40-59 – 26 percent
- 60-69 – 4 percent
- 70+ – 3 percent
- 4 percent of reports did not include age.
- Pedestrians by gender
- Female – 37 percent
- Male – 59 percent
- Unknown – 1 percent
- Unreported – 3 percent
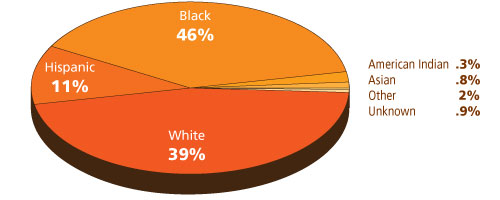
- Pedestrians by race
 American Indian – .3 percent
- Asian – .8 percent
- Black – 46 percent
- Hispanic – 11 percent
- Other – 2 percent
- Unknown – .9 percent
- White – 39 percent
- Bicyclists
- More than 50 percent of all crashes involved bicyclists under the age of 30, while more than 20 percent involved drivers younger than 30.
- Male bicyclists were involved in more than 80 percent of all crashes, while the genders of drivers was almost evenly distributed.
- A disproportionate number of bicyclists involved in crashes were Black.
- Pedestrians by age group
- When do pedestrian crashes most often occur?
-
- Day of the week
- Weekends: 23 percent
- Weekdays: 76 percent
- Season
- Spring: 26 percent
- Summer: 20 percent
- Fall: 31 percent
- Winter: 23 percent
- Day of the week
-
- When do bicyclist crashes most often occur?
-
- Day of the week
- Weekends: 22 percent
- Weekdays: 78 percent
- Time of day
- Weekdays: between 3 and 6 pm
- Weekends: between noon and 4 pm
- Season
- More than half of all crashes, 55 percent, occur from May through September
- Day of the week
-
